
Berkas:2017- Donald Trump veracity - composite graph.png

Ukuran asli (2.775 × 1.750 piksel, ukuran berkas: 141 KB, tipe MIME: image/png)
Ringkasan
| Deskripsi |
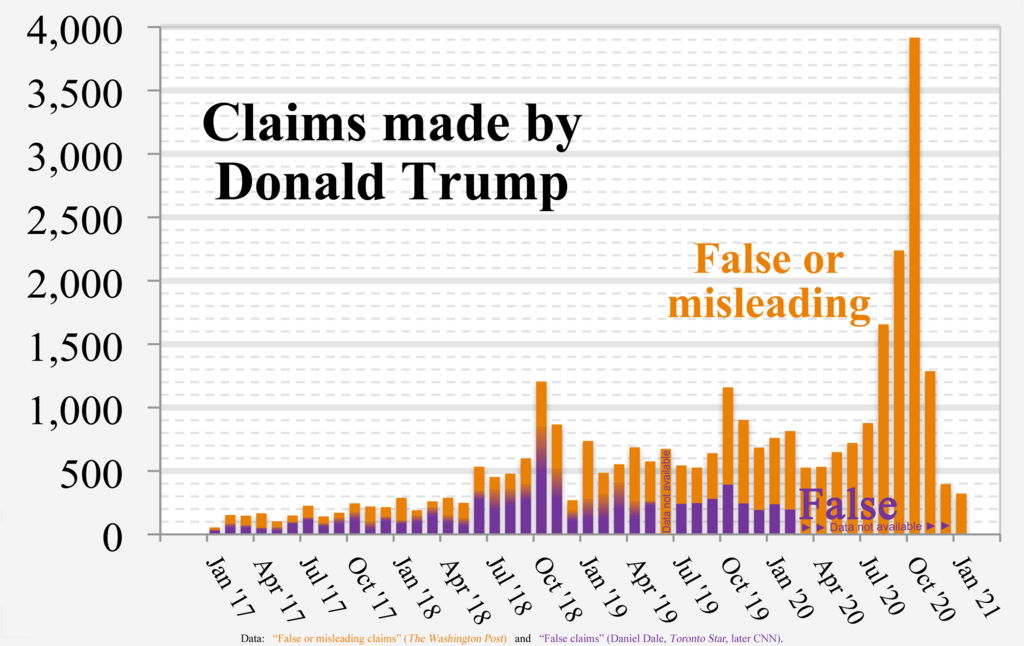
English: Chart of Donald Trump's “False or misleading claims” (The Washington Post) and “False claims” by Daniel Dale (Toronto Star, later CNN)
Technical details:
|
| Tanggal | |
| Sumber | Karya sendiri |
| Pembuat | RCraig09 |
| Versi lainnya |
 |
Source data
- Data used to form fact check from The Washington Post is in image description page for File:2017- Donald Trump - graph - false or misleading claims.png
- Data used to form Toronto Star / CNN graph is in collapsible text:
- Versions 1 through 4:
| Click at right to show/hide data for Toronto Star / CNN portions (center of "error bars" in Versions 1-4) |
|---|
|
Month False statements |
- Version 5+:
| Click at right to show/hide data for Toronto Star / CNN portions (below, inside, and above Gradient regions in Version 5) |
|---|
|
Each three of the following data items are "stacked" (violet, below gradient, below orange) to form a full-height column. Month MIN GRADIENT WashPost |
Lisensi
- Anda diizinkan:
- untuk berbagi – untuk menyalin, mendistribusikan dan memindahkan karya ini
- untuk menggubah – untuk mengadaptasi karya ini
- Berdasarkan ketentuan berikut:
- atribusi – Anda harus mencantumkan atribusi yang sesuai, memberikan pranala ke lisensi, dan memberi tahu bila ada perubahan. Anda dapat melakukannya melalui cara yang Anda inginkan, namun tidak menyatakan bahwa pemberi lisensi mendukung Anda atau penggunaan Anda.
- berbagi serupa – Apabila Anda menggubah, mengubah, atau membuat turunan dari materi ini, Anda harus menyebarluaskan kontribusi Anda di bawah lisensi yang sama seperti lisensi pada materi asli.
Riwayat berkas
Klik pada tanggal/waktu untuk melihat berkas ini pada saat tersebut.
| Tanggal/Waktu | Miniatur | Dimensi | Pengguna | Komentar | |
|---|---|---|---|---|---|
| terkini | 9 Februari 2021 06.23 | | 2.775 × 1.750 (141 KB) | RCraig09 | Version 16: Eliminate Oct 2016 as irrelevant date to include. Reduced filesize at tinypng.com |
| 9 Februari 2021 06.08 |  | 2.775 × 1.750 (140 KB) | RCraig09 | Version 15: Update to include final data for January 2021. Reduced filesize at tinypng.com. | |
| 16 Januari 2021 07.00 |  | 2.775 × 1.750 (520 KB) | RCraig09 | Version 14: Update to include Washington Post data for Nov and Dec 2020 | |
| 5 Januari 2021 23.32 |  | 2.775 × 1.750 (588 KB) | RCraig09 | Version 13: Updated to include Washington Post data through October 2020. | |
| 20 Desember 2020 23.39 |  | 2.775 × 1.750 (495 KB) | RCraig09 | Version 12: Update to include Washington Post data through end of September 2020. | |
| 16 November 2020 07.24 |  | 2.775 × 1.750 (532 KB) | RCraig09 | Version 11: Updating graph to include exact value for August 2020 that no longer involves extrapolation for the last four days of the month. Washington Post added a few more days to their database. | |
| 21 Oktober 2020 22.28 |  | 2.775 × 1.750 (532 KB) | RCraig09 | Version 10: Update to include Washington Post data for July and August 2020. Had to expand vertical scale to accommodate new high in data value (for August 2020). | |
| 13 Juli 2020 06.43 |  | 2.775 × 1.750 (522 KB) | RCraig09 | Version 9: updated to include Washington Post data for June 2020. | |
| 5 Juni 2020 06.00 |  | 2.775 × 1.750 (515 KB) | RCraig09 | Version 8: Updating to include Washington Post data for April and May 2020 | |
| 15 April 2020 20.29 |  | 2.775 × 1.750 (586 KB) | RCraig09 | Version 7: updated to include CNN data for Jan and Feb 2020 |
Penggunaan berkas
Halaman berikut menggunakan berkas ini:
Penggunaan berkas global
Wiki lain berikut menggunakan berkas ini:
- Penggunaan pada ca.wikipedia.org
- Penggunaan pada en.wikipedia.org
- Penggunaan pada he.wikipedia.org
- Penggunaan pada hy.wikipedia.org
- Penggunaan pada ja.wikipedia.org
- Penggunaan pada pfl.wikipedia.org