
Berkas:European-union-renewables-new.svg

Ukuran asli (Berkas SVG, secara nominal 558 × 457 piksel, besar berkas: 313 KB)
Ringkasan
| Deskripsi |
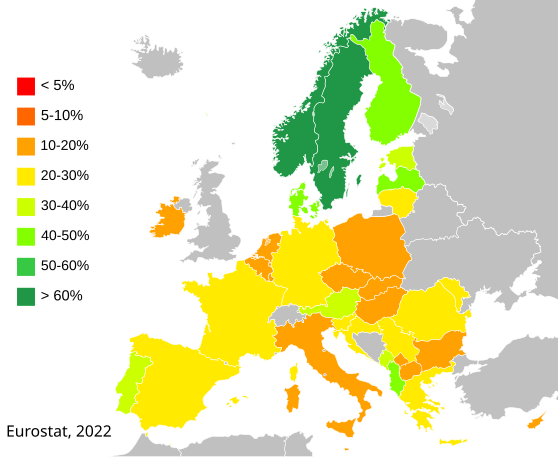
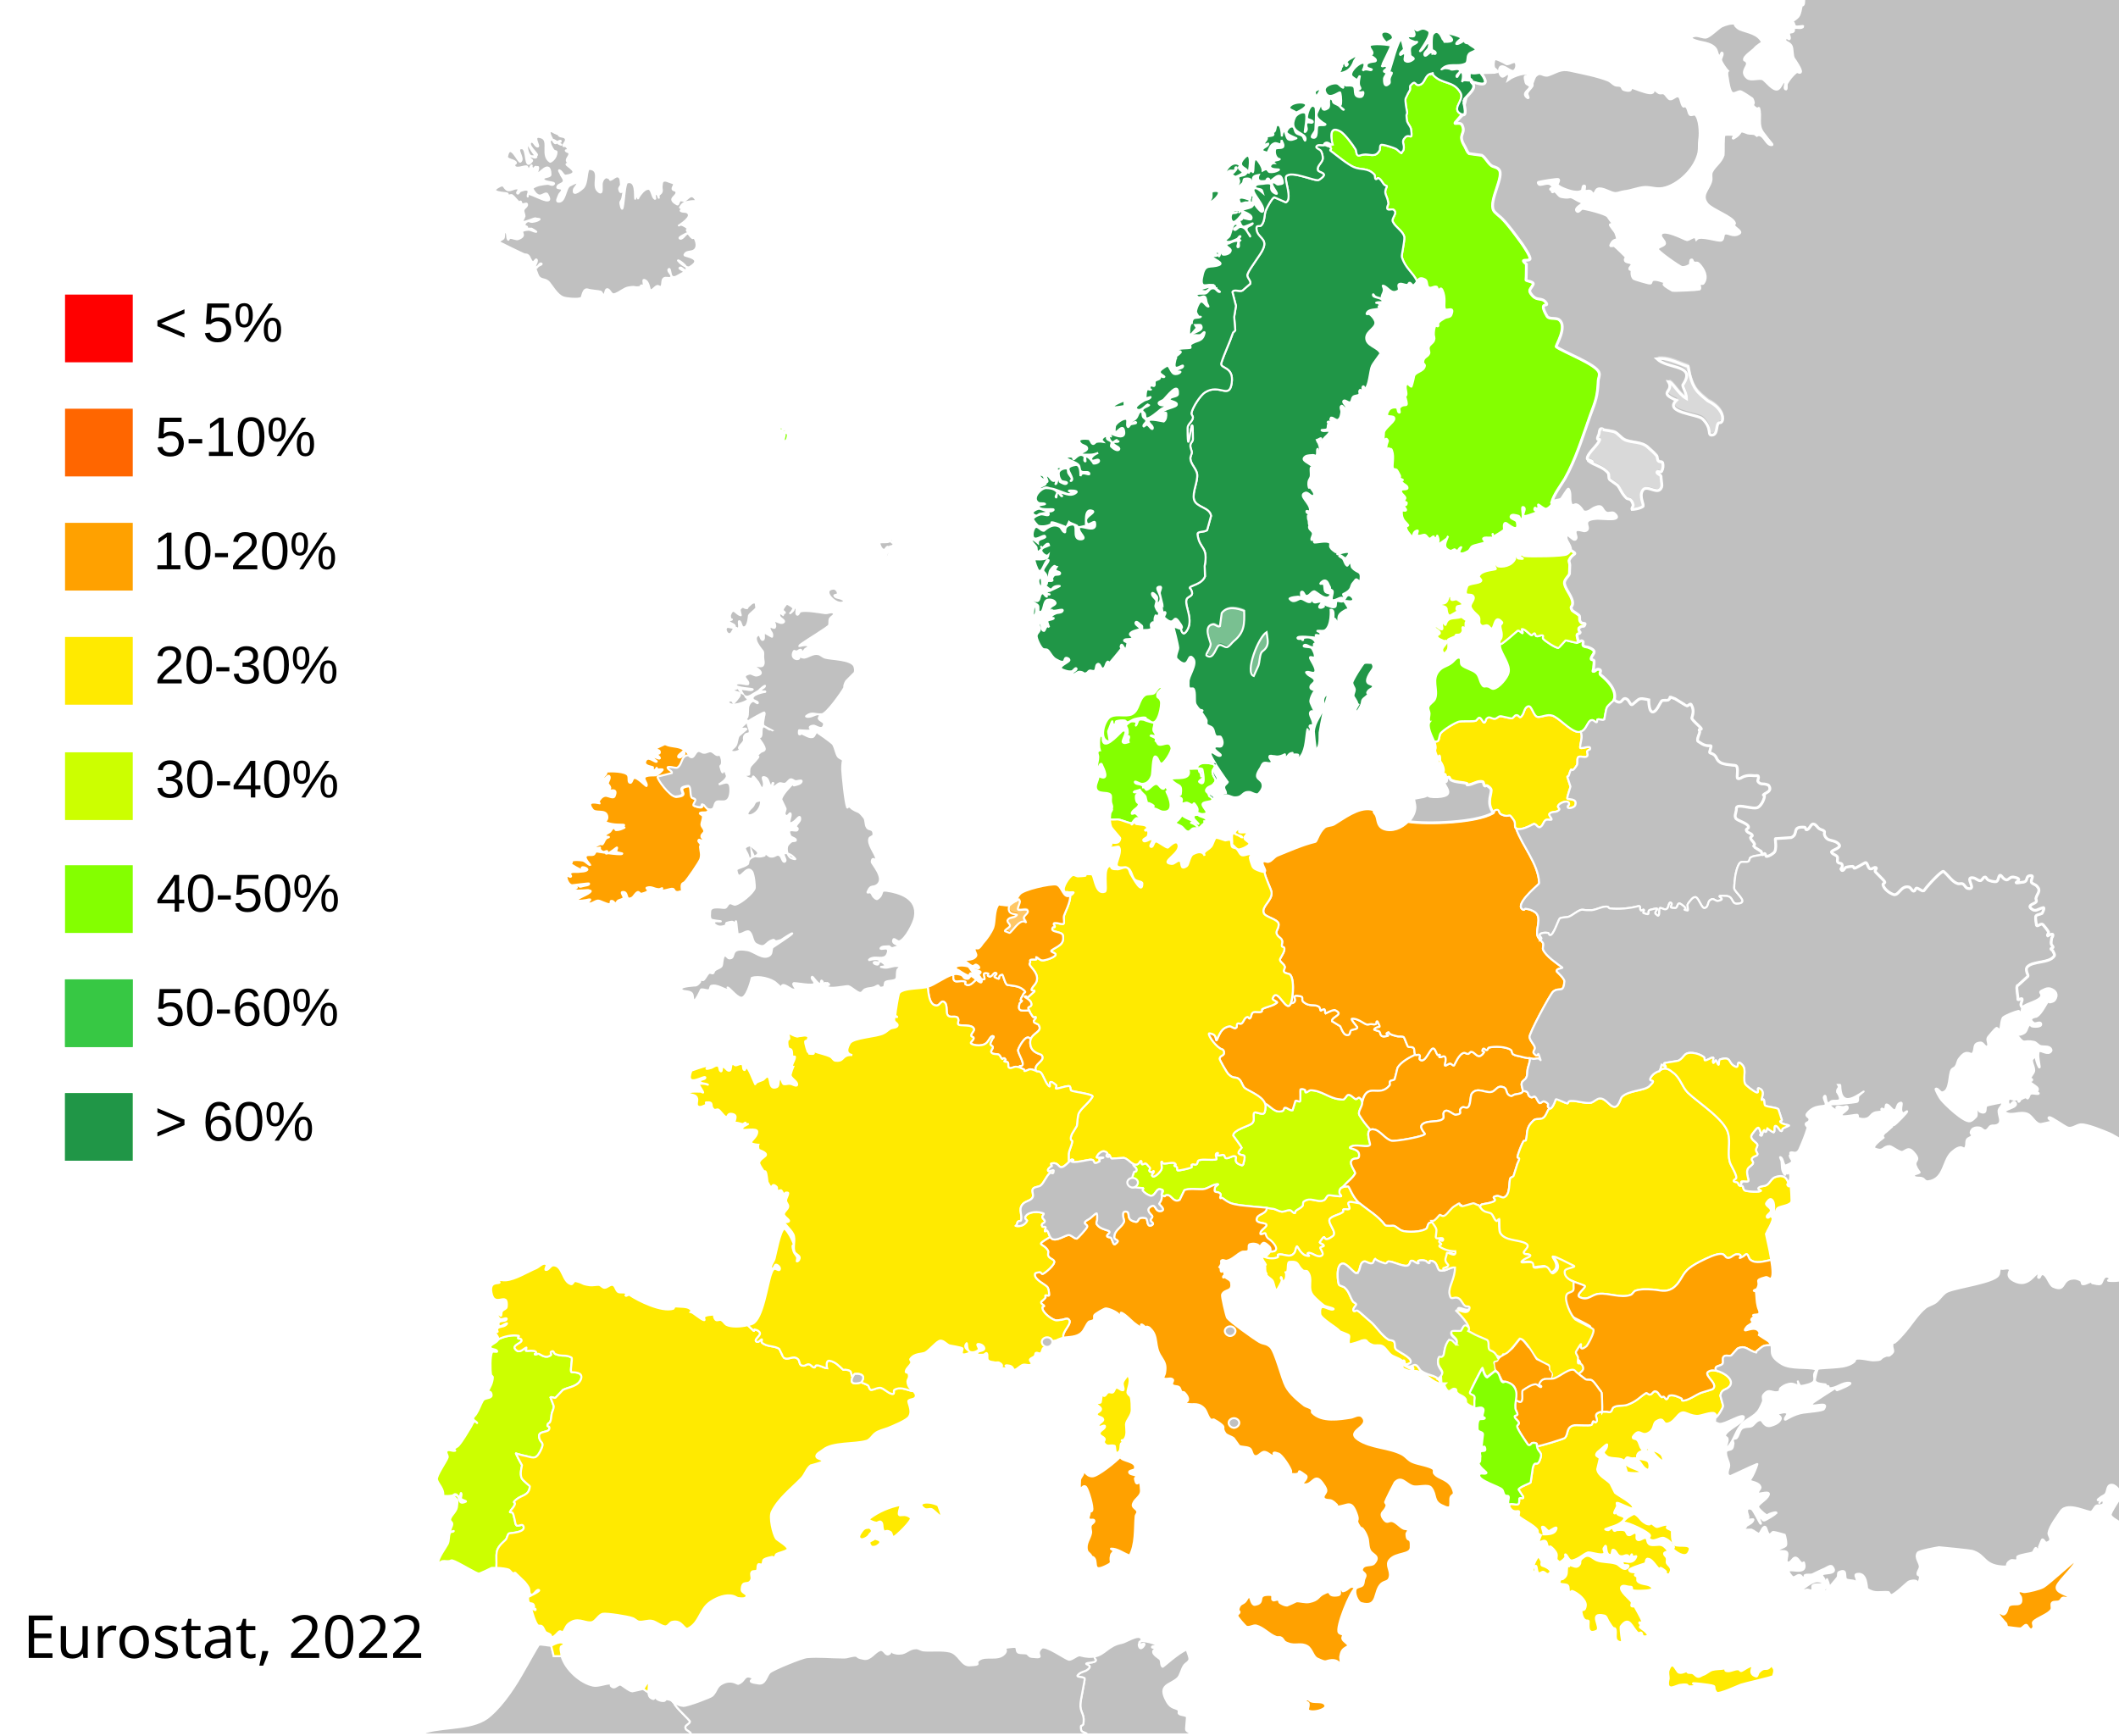
English: Share of renewable energy in gross final energy consumption in 2019. The average of renewable energy in the European Union (EU-28) increased in 2013 by 0.7% to 15.0% compared to 2012.
▇ n.a. Percentage of renewables on the overall energy consumption by country in descending percentage order for 2013: Norway (65.5%), Sweden (52.1%), Latvia (37.1%), Finland (36.8%), Austria (32.6%), Denmark (27.2%), Portugal (25.7%), Estonia (25.6%), Romania (23.9%), Switzerland (21.1%, source: SFOE), Lithuania (23.0%), Slovenia (21.5%), Bulgaria (19.0%), Croatia (18.0%), Italy (16.7%), Spain (15.4%), Greece (15.0%), Average in the European Union (15.0%, EU-28), France (14.2%), Czech Republic (12.4%), Germany (12.4%), Poland (11.3%), Hungary (9.8%), Slovakia (9.8%), Cyprus (8.1%), Belgium (7.9%), Ireland (7.8%), United Kingdom (5.1%), Netherlands (4.5%), Malta (3.8%), Luxembourg (3.6%, estimate). Explanation of the Share of renewable energy in gross final energy consumption. This indicator is calculated on the basis of data covered by Regulation (EC) No 1099/2008 on energy statistics. Reporting countries provide additional information on renewable source not covered by the Regulation. This indicator may be considered an estimate of the indicator described in Directive 2009/28/EC because statistical systems in some countries are not yet fully developed to meet all the requirements of this Directive. More information about the renewable energy shares calculation methodology can be found on the Eurostat websiteČeština: Podíl obnovitelná energie na hrubé konečné spotřebě energie za rok 2019 ve vybraných evropských zemích. Průměrný podíl energie z obnovitelných zdrojů v Evropské unii (EU-28) se v roce 2013 zvýšil o 0,7 % na 15,0 % oproti roku 2012. ▇ nejsou data Procentuální podíl obnovitelných zdrojů na celkové spotřebě energie podle zemí v sestupném procentuálním pořadí za rok 2013: Norsko (65,5 %), Švédsko (52,1 %), Lotyšsko (37,1 %), Finsko (36,8 %), Rakousko (32,6 %), Dánsko (27,2 %), Portugalsko (25,7 %), Estonsko (25,6 %), Rumunsko (23,9 %), Švýcarsko (21,1 %, zdroj: SFOE), Litva (23,0 %), Slovinsko (21,5 %), Bulharsko (19,0 %), Chorvatsko (18,0 %), Itálie (16,7 %), Španělsko (15,4 %), Řecko (15 %). 0%), průměr v Evropské unii" (15,0%, "EU-28"), Francie (14,2%), Česká republika (12,4%), Německo (12,4%), Polsko (11,3%), Maďarsko (9,8%), Slovensko (9,8%), Kypr (8,1%), Belgie (7,9%), Irsko (7,8%), Spojené království (5,1%), Nizozemsko (4,5%), Malta (3,8%), Lucembursko (3,6%, "odhad"). Vysvětlení údaje Podíl energie z obnovitelných zdrojů na hrubé konečné spotřebě energie. Tento ukazatel se vypočítává na základě údajů, na které se vztahuje nařízení (ES) č. 1099/2008 o energetické statistice. Vykazující země poskytují dodatečné informace o obnovitelných zdrojích, na které se nařízení nevztahuje. Tento ukazatel lze považovat za odhad ukazatele popsaného ve směrnici 2009/28/ES, protože statistické systémy v některých zemích ještě nejsou plně vyvinuty tak, aby splňovaly všechny požadavky této směrnice. Více informací o metodice výpočtu podílů energie z obnovitelných zdrojů lze nalézt na stránkách Eurostatu. |
| Tanggal | |
| Sumber |
Karya sendiri berdasarkan: European-union-renewables-fr.svg and EU-candidate countries map.svg
|
| Pembuat | Murraybuckley, Jklamo, Elekhh, Knumitiv |
| Izin (Menggunakan kembali berkas ini) |
The author had released a previous version into the public domain |
| Versi lainnya |
 |
| SVG genesis | Gambar vektor ini dibuat menggunakan Inkscape. |
Lisensi
| Saya, pemegang hak cipta karya ini, merilis karya ini ke domain umum. Lisensi ini berlaku di seluruh dunia. Di sejumlah negara, tindakan ini tidak memungkinkan secara sah; bila seperti itu: Saya memberikan siapa pun hak untuk menggunakan karya ini untuk tujuan apa pun, tanpa persyaratan apa pun, kecuali yang ditetapkan oleh hukum. |
Riwayat berkas
Klik pada tanggal/waktu untuk melihat berkas ini pada saat tersebut.
| Tanggal/Waktu | Miniatur | Dimensi | Pengguna | Komentar | |
|---|---|---|---|---|---|
| terkini | 9 Januari 2024 18.39 | | 558 × 457 (313 KB) | Jexio | Updated to 2022 figures |
| 17 Agustus 2023 18.03 |  | 558 × 457 (313 KB) | Jexio | Updated to 2021 figures | |
| 22 Januari 2022 20.00 |  | 558 × 457 (313 KB) | Jexio | Updated to 2020 figures | |
| 12 Januari 2022 21.39 |  | 558 × 457 (313 KB) | Pavouk | change labels: open fonts | |
| 10 Maret 2021 11.59 |  | 558 × 457 (318 KB) | Knumitiv | 2019 data including Bosnia and Kosovo, without Turkey and Switzerland | |
| 13 Februari 2019 20.15 |  | 703 × 581 (118 KB) | Heycci | Updated to 2017 figures. Added white background. | |
| 15 Februari 2018 22.34 |  | 703 × 581 (118 KB) | Heycci | Updated to 2016 figures. | |
| 22 April 2015 11.43 |  | 703 × 581 (126 KB) | Rfassbind | update Eurostat 2013-figures (see description). Changed colors: UK (>5%) and Slovakia (<10%). Fixed colors for Swedish islands. Amended text in image. | |
| 15 Desember 2014 15.40 |  | 703 × 581 (126 KB) | Rfassbind | Update Switzerland. Amended country's color code and map's footnote. Swiss figures: 21.5% for 2013, Swiss Federal Office of Energy (SFOE). | |
| 7 April 2014 20.57 |  | 703 × 581 (109 KB) | Heycci | Added Switzerland data from 2010 as well. Also (during last update) expanded the table to include 50 - 60% and > 60%. |
Penggunaan berkas
Halaman berikut menggunakan berkas ini:
Penggunaan berkas global
Wiki lain berikut menggunakan berkas ini:
- Penggunaan pada ca.wikipedia.org
- Penggunaan pada cs.wikipedia.org
- Penggunaan pada da.wikipedia.org
- Penggunaan pada de.wikipedia.org
- Penggunaan pada de.wiktionary.org
- Penggunaan pada el.wikipedia.org
- Penggunaan pada en.wikipedia.org
- Penggunaan pada es.wikipedia.org
- Penggunaan pada fi.wikipedia.org
- Penggunaan pada fr.wikipedia.org
- Penggunaan pada hu.wikipedia.org
- Penggunaan pada hy.wikipedia.org
- Penggunaan pada it.wikipedia.org
- Penggunaan pada nl.wikipedia.org
- Penggunaan pada pt.wikipedia.org
- Penggunaan pada sq.wikipedia.org
- Penggunaan pada zh.wikipedia.org