
Berkas:Estradiol during menstrual cycle.png

Ukuran asli (3.682 × 1.640 piksel, ukuran berkas: 492 KB, tipe MIME: image/png)
Ringkasan
| Deskripsi |
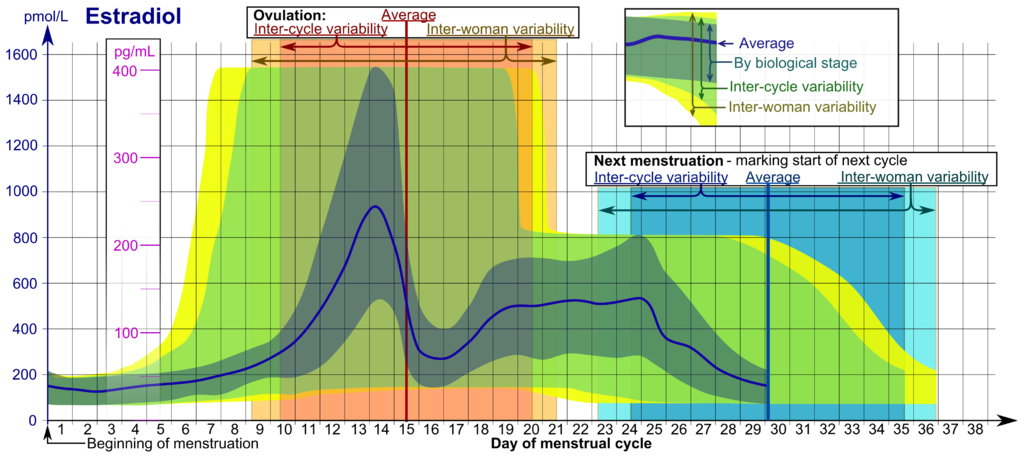
English: Reference ranges for the blood content of estradiol during the menstrual cycle.
InterpretationThe time scale starts with the beginning (or "onset") of (last) menstrual period (LMP), given as day number. Day number 1 corresponds to 0 to 0.99 days from LMP, and Day number 2 corresponds to 1.00 to 1.99 days from LMP and so forth. The time scale ends at whatever is the actual next menstruation, which marks the beginning of the next cycle, which is equivalent to starting all over again from the beginning of the time scale.
Hormone levels represent usual ones, not necessarily related to what is healthy. Hormone ranges vary between cases at the same biological stage of the menstrual cycle. Furthermore, the actual timing (usually given in day numbers from mentruation) of that biological stage varies, both between cycles of any single woman (inter-cycle) and between somen (inter-woman). Therefore, the appropriate ranges to use depend on how certain the actual biological stage can be estimated at any time.
DerivationSee source article:
|
| Tanggal | |
| Sumber |
Karya sendiri.
 |
| Pembuat |
This image can be cited as:
|
| Versi lainnya |
Lisensi
| Saya, pemegang hak cipta karya ini, merilis karya ini ke domain umum. Lisensi ini berlaku di seluruh dunia. Di sejumlah negara, tindakan ini tidak memungkinkan secara sah; bila seperti itu: Saya memberikan siapa pun hak untuk menggunakan karya ini untuk tujuan apa pun, tanpa persyaratan apa pun, kecuali yang ditetapkan oleh hukum. |
Riwayat berkas
Klik pada tanggal/waktu untuk melihat berkas ini pada saat tersebut.
| Tanggal/Waktu | Miniatur | Dimensi | Pengguna | Komentar | |
|---|---|---|---|---|---|
| terkini | 22 Januari 2011 14.03 | | 3.682 × 1.640 (492 KB) | Mikael Häggström | Some fixes |
| 22 Januari 2011 07.23 | 4.279 × 1.640 (524 KB) | Mikael Häggström | {{Information |Description={{en|1=Estradiol {{Description of menstrual cycle diagrams}}}} |Source={{own}} |Author=Mikael Häggström |Date=2011-01-22 |Permission= |other_versions= }} |
Penggunaan berkas
Halaman berikut menggunakan berkas ini:
Penggunaan berkas global
Wiki lain berikut menggunakan berkas ini:
- Penggunaan pada ar.wikipedia.org
- Penggunaan pada as.wikipedia.org
- Penggunaan pada bs.wikipedia.org
- Penggunaan pada de.wikipedia.org
- Penggunaan pada en.wikipedia.org
- Penggunaan pada en.wikiversity.org
- Penggunaan pada es.wikipedia.org
- Penggunaan pada gl.wikipedia.org
- Penggunaan pada he.wikipedia.org
- Penggunaan pada hy.wikipedia.org
- Penggunaan pada ml.wikipedia.org
- Penggunaan pada pt.wikipedia.org
- Penggunaan pada sl.wikipedia.org
- Penggunaan pada sr.wikipedia.org
- Penggunaan pada sv.wikipedia.org
- Penggunaan pada uk.wikipedia.org
- Penggunaan pada www.wikidata.org
- Penggunaan pada zh.wikipedia.org
- Penggunaan pada zh.wikiversity.org