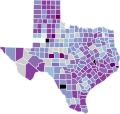
Berkas:COVID-19 rolling 14day Prevalence in Texas by county.svg

Konten halaman tidak didukung dalam bahasa lain.
Dari Wikipedia bahasa Indonesia, ensiklopedia bebas

Ukuran asli(Berkas SVG, secara nominal 400 × 380 piksel, besar berkas: 160 KB)

Berkas ini berasal dari Wikimedia Commons dan mungkin digunakan oleh proyek-proyek lain. Deskripsi dari halaman deskripsinya ditunjukkan di bawah ini.

Ringkasan

Deskripsi
English: {| cellspacing="8" cellpadding="0" style="width:100%; clear:both; margin:0.5em auto; background-color:#f7f8ff; border:2px solid #4488dd; direction:ltr;"

| style="width:50px" | | Berkas ini mungkin perlu diperbarui untuk menyesuaikan dengan informasi baru.
Jika Anda ingin menggunakan versi spesifik berkas tanpa mencerminkan pembaruan, tolong unggah versi yang dibutuhkan sebagai berkas terpisah. |} This map shows confirmed cases of w:en:COVID-19, coded by percentage of population confirmed to be infected in the 14 days leading up to 29 March 2021. The data is used from the data as aggregated and released by Johns Hopkins University and US census (2019 population estimate). As this is a current outbreak, the map might not be up to date.

 
1000+ confirmed new cases per 100,000 population
 
500 - 1000 confirmed new cases per 100,000 population
 
200 - 500 confirmed new cases per 100,000 population
 
100 - 200 confirmed new cases per 100,000 population
 
50 - 100 confirmed new cases per 100,000 population
 
20 - 50 confirmed new cases per 100,000 population
 
10 - 20 confirmed new cases per 100,000 population
 
0 - 10 confirmed new cases per 100,000 population
 
No confirmed new cases

The design is based on blank maps available in Public Domain (created by Yiling Chen from TIGER shapefiles). The script for creating the maps was written by Sukolsak Sakshuwong and Lodewijk Gelauff. Color scheme is based on ColorBrewer 6-class BuPu.


known issues with the data
* Cases from counties named 'Out of <state>' are not represented (these have no geographic representation)
  • Cases from counties named 'Unassigned' are not represented (these have no geographic representation)
  • The data from Dukes and Nantucket, MA may be distorted because sources represent them differently.
  • The data from the 5 counties of New York City are merged and prevalence is calculated jointly.
  • Cases from counties "Michigan Department of Corrections (MDOC)" and "Federal Correctional Institution (FCI)" (both Michigan) are not represented (these have no geographic representation)
  • The data from the health districts of Utah span multiple counties and prevalence is calculated for those jointly.
  • The data from the 4 counties and city of Kansas City (Jackson, Clay, Platte, Cass) are merged and prevalence is calculated jointly.
  • Beginning August 19, only confirmed cases are counted in county total cases for Massachusetts. This makes it appear as though the case numbers have dropped, and until 14 days after that date, Massachusetts counties are likely to remain 'no data'.
Tanggal
Sumber Karya sendiri
Pembuat Effeietsanders

Lisensi

Saya, pemilik hak cipta dari karya ini, dengan ini menerbitkan berkas ini di bawah ketentuan berikut:
Creative Commons CC-Zero Berkas ini dilepaskan di bawah CC0 1.0 Dedikasi Domain Publik Universal Creative Commons.
Orang yang mengaitkan suatu karya dengan dokumen ini telah mendedikasikan karyanya sebagai domain publik dengan mengabaikan semua hak ciptanya di seluruh dunia menurut hukum hak cipta, termasuk semua hak yang terkait dan berhubungan, sejauh yang diakui hukum. Anda dapat menyalin, menyebarkan, dan mempertunjukkan karya, bahkan untuk tujuan komersial, tanpa meminta izin.

Captions

Add a one-line explanation of what this file represents
Rolling 14-day prevalence of new COVID-19 cases by county

Items portrayed in this file

menggambarkan

26 Mei 2020

image/svg+xml

checksum Inggris

7012aab510a95091973eec76476ccd47f2c1aec9

164.259 Bita

380 piksel

400 piksel

Riwayat berkas

Klik pada tanggal/waktu untuk melihat berkas ini pada saat tersebut.

(terbaru | terlama) Lihat (10 lebih baru | ) (10 | 20 | 50 | 100 | 250 | 500)
Tanggal/WaktuMiniaturDimensiPenggunaKomentar
terkini30 Maret 2021 23.55Miniatur versi sejak 30 Maret 2021 23.55400 × 380 (160 KB)Eiabotnew data: 29 March 2021
29 Maret 2021 05.08Miniatur versi sejak 29 Maret 2021 05.08400 × 380 (160 KB)Eiabotnew data: 28 March 2021
29 Maret 2021 01.34Miniatur versi sejak 29 Maret 2021 01.34400 × 380 (160 KB)Eiabotnew data: 27 March 2021
28 Maret 2021 05.43Miniatur versi sejak 28 Maret 2021 05.43400 × 380 (160 KB)Eiabotnew data: 26 March 2021
27 Maret 2021 02.02Miniatur versi sejak 27 Maret 2021 02.02400 × 380 (160 KB)Eiabotnew data: 25 March 2021
26 Maret 2021 05.27Miniatur versi sejak 26 Maret 2021 05.27400 × 380 (160 KB)Eiabotnew data: 24 March 2021
25 Maret 2021 00.05Miniatur versi sejak 25 Maret 2021 00.05400 × 380 (160 KB)Eiabotnew data: 23 March 2021
22 Maret 2021 16.03Miniatur versi sejak 22 Maret 2021 16.03400 × 380 (160 KB)Eiabotnew data: 21 March 2021
21 Maret 2021 06.14Miniatur versi sejak 21 Maret 2021 06.14400 × 380 (160 KB)Eiabotnew data: 20 March 2021
21 Maret 2021 00.11Miniatur versi sejak 21 Maret 2021 00.11400 × 380 (160 KB)Eiabotnew data: 19 March 2021
(terbaru | terlama) Lihat (10 lebih baru | ) (10 | 20 | 50 | 100 | 250 | 500)

Halaman berikut menggunakan berkas ini:

Metadata