
Berkas:Angular map of fusors around Sol within 12ly.png
Ukuran asli (864 × 871 piksel, ukuran berkas: 81 KB, tipe MIME: image/png)
Ringkasan
| Deskripsi |
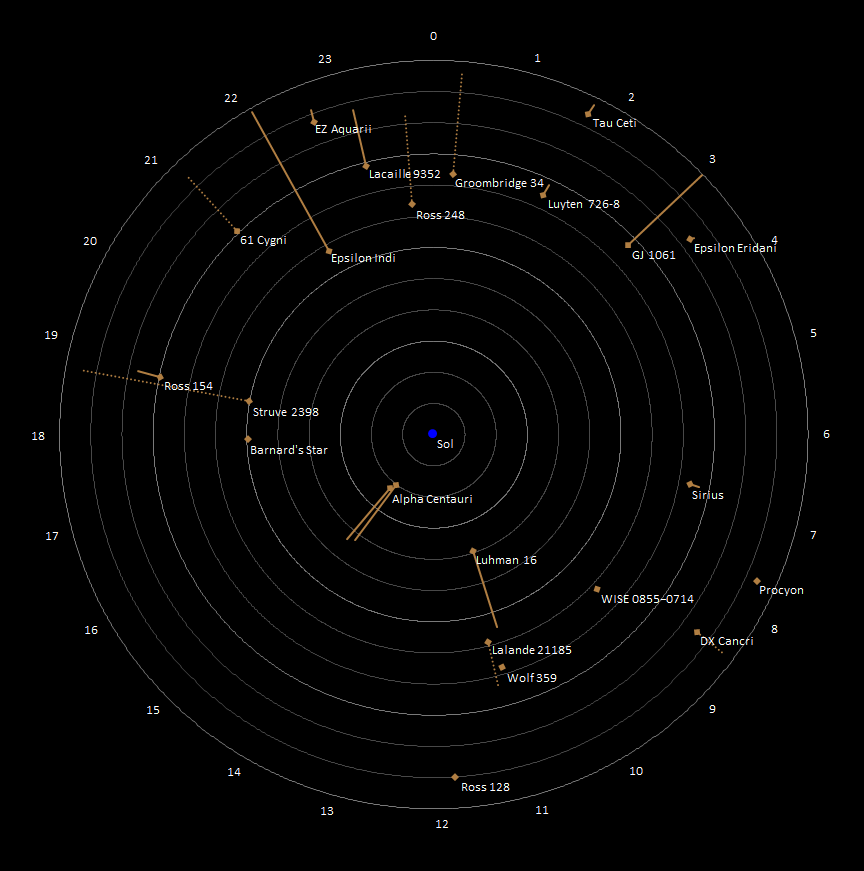
English: This is a stellar map, employing an original map concept, which combines graphically the distance of all stellar systems or singular fusors (stars and brown dwarfs) and sub-brown dwarfs within 12 light-years (ly) or 3.7 parsecs from Earth, along with their angular location as viewed from Earth. The result provides a readable and correct depiction of the distance from the center (Earth/Sol) and location in three dimensional space of the described stellar objects, allowing a correct depiction of proximity among the depicted stellar objects.
How to read: This map is a common radar screen type of map displaying stellar objects around Sol. Each stellar object is marked jointly by two points, a diamond marked point and an line marked point, as well as an either unbroken or dotted straight line which connects the two points.
The circular lines indicate the distance from the map-center by being set apart in one light-year steps. At the outermost circular line the hours angle for the right ascension is displayed clockwise. The circular lines therefore represent the hour-axis and, through their repetition in one light-year steps, the distance-axis.
The straight lines (unbroken or dotted) represent the arcs of the declination angles (see also circular sector of a unit circle) of the stellar objects on their hour circle toward the celestial poles (with the poles being congruent with the center of the map). Since the map is viewed top-down from the south, allowing a clockwise eastward-reading (opposed to when using sidereal hour angles), the dotted straight lines are arcs with positive declination, down from the reference plane/level, toward the star Polaris, the northern celestial pole (which would be allmost congruent with the center of the map, if it would display stars further than 12 ly). That said the straight lines also represent a top-down view of the hypotenuse between the points of a right-angled triangle with its right-angle on the plane/level; but the straight lines, when viewed true to length, represent the base x-line of the described triangle.
x = "distance of the stellar objects to the map-center in ly" - ("distance of the stellar objects to the map-center in ly" * sin(180°-90°-"declination"))  Note: Proxima Centauri is the only marked stellar object not labled and not being an independent stellar object or the primary body of a stellar system (which in its case is Alpha Centauri), but still being noteworthy since it is the closest fusor to Sol.
Epoch J2000.0, see List of nearest stars and brown dwarfs. Produced with Microsoft Excel (radar chart) |
| Tanggal | |
| Sumber | Karya sendiri |
| Pembuat | Nsae Comp |
| Versi lainnya |
|
.png)

.png)
Lisensi
- Anda diizinkan:
- untuk berbagi – untuk menyalin, mendistribusikan dan memindahkan karya ini
- untuk menggubah – untuk mengadaptasi karya ini
- Berdasarkan ketentuan berikut:
- atribusi – Anda harus mencantumkan atribusi yang sesuai, memberikan pranala ke lisensi, dan memberi tahu bila ada perubahan. Anda dapat melakukannya melalui cara yang Anda inginkan, namun tidak menyatakan bahwa pemberi lisensi mendukung Anda atau penggunaan Anda.
- berbagi serupa – Apabila Anda menggubah, mengubah, atau membuat turunan dari materi ini, Anda harus menyebarluaskan kontribusi Anda di bawah lisensi yang sama seperti lisensi pada materi asli.
Riwayat berkas
Klik pada tanggal/waktu untuk melihat berkas ini pada saat tersebut.
| Tanggal/Waktu | Miniatur | Dimensi | Pengguna | Komentar | |
|---|---|---|---|---|---|
| terkini | 13 Februari 2021 14.58 | | 864 × 871 (81 KB) | Nsae Comp | Positive declination as doted line, since view from the south. |
| 3 Februari 2021 14.56 |  | 868 × 875 (79 KB) | Nsae Comp | Uploaded own work with UploadWizard |
Penggunaan berkas
Halaman berikut menggunakan berkas ini:
Penggunaan berkas global
Wiki lain berikut menggunakan berkas ini:
- Penggunaan pada ban.wikipedia.org
- Penggunaan pada en.wikipedia.org