Berkas:Tautochrone curve.gif

Konten halaman tidak didukung dalam bahasa lain.
Dari Wikipedia bahasa Indonesia, ensiklopedia bebas

Tautochrone_curve.gif(300 × 200 piksel, ukuran berkas: 102 KB, tipe MIME: image/gif, melingkar, 80 frame, 3,2 d)

Berkas ini berasal dari Wikimedia Commons dan mungkin digunakan oleh proyek-proyek lain. Deskripsi dari halaman deskripsinya ditunjukkan di bawah ini.

Ringkasan

Deskripsi

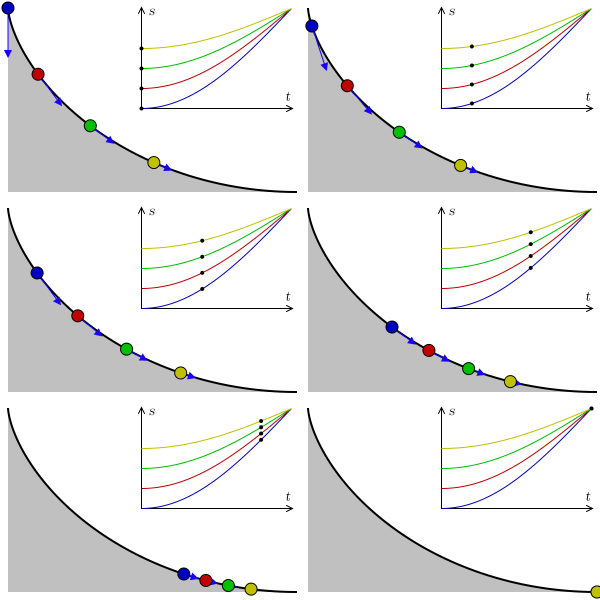
A tautochrone curve is the curve for which the time taken by an object sliding without friction in uniform gravity to its lowest point is independent of its starting point. Here, four points at different positions reach the bottom at the same time.


In the graphic, s represents arc length, t represents time, and the blue arrows represent acceleration along the trajectory. As the points reach the horizontal, the velocity becomes constant, the arc length being linear to time.
Tanggal 9 Mei 2007; new version Agustus 2009
Sumber Karya sendiri
Pembuat

Claudio Rocchini

rewritten by Geek3
GIF genesis
InfoField
 
GIF Grafik ini dibuat menggunakan Matplotlib
Kode sumber
InfoField

Python code

#!/usr/bin/python
# -*- coding: utf8 -*-

'''
animation of balls on a tautochrone curve
'''

import os
import numpy as np
import matplotlib.pyplot as plt
import matplotlib.patches as patches
from matplotlib import animation
from math import *

# settings
fname = 'Tautochrone curve'
width, height = 300, 200
nframes = 80
fps=25

balls = [
{'a':1.0, 'color':'#0000c0'},
{'a':0.8, 'color':'#c00000'},
{'a':0.6, 'color':'#00c000'},
{'a':0.4, 'color':'#c0c000'}]

def curve(phi):
    x = phi + sin(phi)
    y = 1.0 - cos(phi)
    return np.array([x, y])

def animate(nframe, empty=False):
    t = nframe / float(nframes - 1.)
    
    # prepare a clean and image-filling canvas for each frame
    fig = plt.gcf()
    fig.clf()
    ax_canvas = plt.gca()
    ax_canvas.set_position((0, 0, 1, 1))
    ax_canvas.set_xlim(0, width)
    ax_canvas.set_ylim(0, height)
    ax_canvas.axis('off')
    
    # draw the ramp
    x0, y0 = 293, 8
    h = 182
    npoints = 200
    points = []
    for i in range(npoints):
        phi = i / (npoints - 1.0) * pi - pi
        x, y = h/2. * curve(phi) + np.array([x0, y0])
        points.append([x, y])
    
    rampline = patches.Polygon(points, closed=False, facecolor='none',
                       edgecolor='black', linewidth=1.5, capstyle='butt')
    points += [[x0-h*pi/2, y0], [x0-h*pi/2, y0+h]]
    
    ramp = patches.Polygon(points, closed=True, facecolor='#c0c0c0', edgecolor='none')
    
    # plot axes
    plotw = 0.5
    ax_plot = fig.add_axes((0.47, 0.46, plotw, plotw*2/pi*width/height))
    ax_plot.set_xlim(0, 1)
    ax_plot.set_ylim(0, 1)
    for b in balls:
        time_array = np.linspace(0, 1, 201)
        phi_pendulum_array = (1 - b['a'] * np.cos(time_array*pi/2))
        ax_plot.plot(time_array, phi_pendulum_array, '-', color=b['color'], lw=.8)
    ax_plot.set_xticks([])
    ax_plot.set_yticks([])
    ax_plot.set_xlabel('t')
    ax_plot.set_ylabel('s')
    
    ax_canvas.add_patch(ramp)
    ax_canvas.add_patch(rampline)
    
    for b in balls:
        # draw the balls
        phi_pendulum = b['a'] * -cos(t * pi/2)
        phi_wheel = 2 * asin(phi_pendulum)
        phi_wheel = -abs(phi_wheel)
        x, y = h/2. * curve(phi_wheel) + np.array([x0, y0])
        ax_canvas.add_patch(patches.Circle((x, y), radius=6., zorder=3,
                            facecolor=b['color'], edgecolor='black'))
        ax_plot.plot([t], [1 + phi_pendulum], '.', ms=6., mec='none', mfc='black')
        
        v = h/2. * np.array([1 + cos(phi_wheel), sin(phi_wheel)])
        vnorm = v / hypot(v[0], v[1])
        # in the harmonic motion, acceleration is proportional to -position
        acc_along_line = 38. * -phi_pendulum * vnorm
        ax_canvas.arrow(x, y, acc_along_line[0], acc_along_line[1],
                 head_width=6, head_length=6, fc='#1b00ff', ec='#1b00ff')

fig = plt.figure(figsize=(width/100., height/100.))
print 'saving', fname + '.gif'
#anim = animation.FuncAnimation(fig, animate, frames=nframes)
#anim.save(fname + '.gif', writer='imagemagick', fps=fps)

frames = []
for nframe in range(nframes):
    frame = fname + '_{:02}.png'.format(nframe)
    animation.FuncAnimation(fig, lambda n: animate(nframe), frames=1).save(
        frame, writer='imagemagick')
    frames.append(frame)

# assemble animation using imagemagick, this avoids dithering and huge filesize
os.system('convert -delay {} +dither +remap -layers Optimize {} "{}"'.format(
    100//fps, ' '.join(['"' + f + '"' for f in frames]), fname + '.gif'))
for frame in frames:
    if os.path.exists(frame):
        os.remove(frame)

Lisensi

Saya, pemilik hak cipta dari karya ini, dengan ini menerbitkan berkas ini di bawah ketentuan berikut:
GNU head Diizinkan untuk menyalin, mendistribusikan dan/atau memodifikasi dokumen ini di bawah syarat-syarat Lisensi Dokumentasi Bebas GNU, Versi 1.2 atau lebih baru yang diterbitkan oleh Free Software Foundation; tanpa Bagian Invarian, tanpa Teks Sampul Depan, dan tanpa Teks Sampul Belakang. Salinan lisensi dimasukkan ke bagian yang berjudul Lisensi Dokumentasi Bebas GNU.
w:id:Creative Commons
atribusi berbagi serupa
Berkas on ipartandoan sian on Creative Commons Attribution-Share Alike 3.0 Unported partadoan.
Anda diizinkan:
  • untuk berbagi – untuk menyalin, mendistribusikan dan memindahkan karya ini
  • untuk menggubah – untuk mengadaptasi karya ini
Berdasarkan ketentuan berikut:
  • atribusi – Anda harus mencantumkan atribusi yang sesuai, memberikan pranala ke lisensi, dan memberi tahu bila ada perubahan. Anda dapat melakukannya melalui cara yang Anda inginkan, namun tidak menyatakan bahwa pemberi lisensi mendukung Anda atau penggunaan Anda.
  • berbagi serupa – Apabila Anda menggubah, mengubah, atau membuat turunan dari materi ini, Anda harus menyebarluaskan kontribusi Anda di bawah lisensi yang sama seperti lisensi pada materi asli.
Label lisensi ini ditambahkan pada berkas sebagai bagian dari pemutakhiran lisensi GFDL.
w:id:Creative Commons
atribusi
Berkas ini dilisensikan dengan lisensi Creative Commons Atribusi 2.5 Generik.
Anda diizinkan:
  • untuk berbagi – untuk menyalin, mendistribusikan dan memindahkan karya ini
  • untuk menggubah – untuk mengadaptasi karya ini
Berdasarkan ketentuan berikut:
  • atribusi – Anda harus mencantumkan atribusi yang sesuai, memberikan pranala ke lisensi, dan memberi tahu bila ada perubahan. Anda dapat melakukannya melalui cara yang Anda inginkan, namun tidak menyatakan bahwa pemberi lisensi mendukung Anda atau penggunaan Anda.
Anda dapat memilih lisensi pilihan Anda.

Captions

Add a one-line explanation of what this file represents

Items portrayed in this file

menggambarkan

9 Mei 2007

image/gif

Riwayat berkas

Klik pada tanggal/waktu untuk melihat berkas ini pada saat tersebut.

Tanggal/WaktuMiniaturDimensiPenggunaKomentar
terkini1 Agustus 2009 13.15Miniatur versi sejak 1 Agustus 2009 13.15300 × 200 (102 KB)Geek3new physically correct version
9 Mei 2007 06.56Miniatur versi sejak 9 Mei 2007 06.56300 × 200 (602 KB)Rocchini{{Information |Description=Tautochrone curve animation (4 points runs over a cycloid) |Source=Own work |Date=2007-05-09 |Author=Claudio Rocchini |Permission=CC-BY 2.5 }}

Halaman berikut menggunakan berkas ini:

Penggunaan berkas global

Wiki lain berikut menggunakan berkas ini: