Berkas:StationaryStatesAnimation.gif

Konten halaman tidak didukung dalam bahasa lain.
Dari Wikipedia bahasa Indonesia, ensiklopedia bebas

StationaryStatesAnimation.gif(300 × 280 piksel, ukuran berkas: 223 KB, tipe MIME: image/gif, melingkar, 41 frame)

Berkas ini berasal dari Wikimedia Commons dan mungkin digunakan oleh proyek-proyek lain. Deskripsi dari halaman deskripsinya ditunjukkan di bawah ini.

Ringkasan

Deskripsi
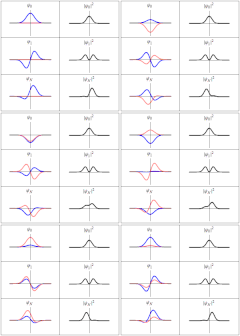
English: Three wavefunction solutions to the Time-Dependent Schrödinger equation for a harmonic oscillator. Left: The real part (blue) and imaginary part (red) of the wavefunction. Right: The probability of finding the particle at a certain position. The top two rows are the lowest two energy eigenstates, and the bottom is the superposition state , which is not an energy eigenstate. The right column illustrates why energy eigenstates are also called "stationary states".
Thus in every quantum stae,there are certain preferred positions of maximum probability
Tanggal
Sumber Karya sendiri
Pembuat Sbyrnes321
(* Source code written in Mathematica 6.0 by Steve Byrnes, Feb. 2011. This source code is public domain. *)
(* Shows classical and quantum trajectory animations for a harmonic potential. Assume m=w=hbar=1. *)
ClearAll["Global`*"]
(*** Wavefunctions of the energy eigenstates ***)
psi[n_, x_] := (2^n*n!)^(-1/2)*Pi^(-1/4)*Exp[-x^2/2]*HermiteH[n, x];
energy[n_] := n + 1/2;
psit[n_, x_, t_] := psi[n, x] Exp[-I*energy[n]*t];
(*** A non-stationary state ***)
SeedRandom[1];
psinonstationary[x_, t_] := (psit[0, x, t]+psit[1, x, t])/Sqrt[2];

(*** Put all the plots together ***)
SetOptions[Plot, {PlotRange -> {-1, 1}, Ticks -> None, PlotStyle -> {Directive[Thick, Blue], Directive[Thick, Pink]}}];
MakeFrame[t_] := GraphicsGrid[
   {{Plot[{Re[psit[0, x, t]], Im[psit[0, x, t]]}, {x, -5, 5}, PlotLabel -> Subscript[\[Psi],0]], 
     Plot[Abs[psit[0, x, t]]^2, {x, -5, 5}, PlotStyle -> Directive[Thick, Black],
		PlotLabel -> TraditionalForm[Abs[Subscript[\[Psi],0]]^2]]},
   {Plot[{Re[psit[1, x, t]], Im[psit[1, x, t]]}, {x, -5, 5}, PlotLabel -> Subscript[\[Psi],1]], 
     Plot[Abs[psit[1, x, t]]^2, {x, -5, 5}, PlotStyle -> Directive[Thick, Black],
		PlotLabel -> TraditionalForm[Abs[Subscript[\[Psi],1]]^2]]},
   {Plot[{Re[psinonstationary[x, t]], Im[psinonstationary[x, t]]}, {x, -5, 5}, PlotLabel -> Subscript[\[Psi],N]], 
     Plot[Abs[psinonstationary[x, t]]^2, {x, -5, 5}, PlotStyle -> Directive[Thick, Black],
		PlotLabel -> TraditionalForm[Abs[Subscript[\[Psi],N]]^2]]}
   }, Frame -> All, ImageSize -> 300];
output = Table[MakeFrame[t], {t, 0, 4 Pi*40/41, 4 Pi/41}];
SetDirectory["C:\\Users\\Steve\\Desktop"]
Export["test.gif", output]

Lisensi

Saya, pemilik hak cipta dari karya ini, dengan ini menerbitkan berkas ini di bawah ketentuan berikut:
Creative Commons CC-Zero Berkas ini dilepaskan di bawah CC0 1.0 Dedikasi Domain Publik Universal Creative Commons.
Orang yang mengaitkan suatu karya dengan dokumen ini telah mendedikasikan karyanya sebagai domain publik dengan mengabaikan semua hak ciptanya di seluruh dunia menurut hukum hak cipta, termasuk semua hak yang terkait dan berhubungan, sejauh yang diakui hukum. Anda dapat menyalin, menyebarkan, dan mempertunjukkan karya, bahkan untuk tujuan komersial, tanpa meminta izin.

Captions

Add a one-line explanation of what this file represents

Items portrayed in this file

menggambarkan

20 Maret 2011

Riwayat berkas

Klik pada tanggal/waktu untuk melihat berkas ini pada saat tersebut.

Tanggal/WaktuMiniaturDimensiPenggunaKomentar
terkini20 Maret 2011 18.21Miniatur versi sejak 20 Maret 2011 18.21300 × 280 (223 KB)Sbyrnes321{{Information |Description ={{en|1=Three wavefunction solutions to the Time-Dependent Schrödinger equation for a harmonic oscillator. Left: The real part (blue) and imaginary part (red) of the wavefunction. Right: The probability of finding the partic

3 halaman berikut menggunakan berkas ini:

Penggunaan berkas global

Wiki lain berikut menggunakan berkas ini: