Daftar kota di Australia menurut populasi

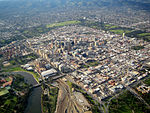
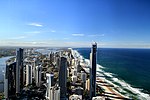
ini hanyalah Daftar kota-kota besar di Australia . Kota-kota yang terdaftar diberikan peringkat dari yang paling besar ke yang paling kecil. Kota-kota diberikan peringkat berdasarkan wilayah statistik Ibukota (tidak termasuk Canberra) .
Terbesar dalam statistik Ibukota daerah/perkotaan[sunting | sunting sumber]
| Rank | GCCSA/SUA | State/Territory | June 2018[1] | 2011 Census[2] Population | Growth | Percentage of
national population (June 2018) |
|---|---|---|---|---|---|---|
| 1 | Sydney | New South Wales | 5,230,330 | 4.391.674 | +19.10% | 20.93% |
| 2 | Melbourne | Victoria | 4,936,349 | 3.999.982 | +24.08% | 19.86% |
| 3 | Brisbane | Queensland | 2,462,637 | 2.065.996 | +19.20% | 9.85% |
| 4 | Perth | Western Australia | 2,059,484 | 1.728.867 | +19.12% | 8.24% |
| 5 | Adelaide | South Australia | 1,345,777 | 1.262.940 | +6.56% | 5.38% |
| 6 | Gold Coast–Tweed Heads | Queensland/New South Wales | 679,127 | 557.822 | +21.75% | 2.72% |
| 7 | Newcastle–Maitland | New South Wales | 486,704 | 398.770 | +22.05% | 1.95% |
| 8 | Canberra–Queanbeyan | Australian Capital Territory/New South Wales | 457,563 | 391.645 | +16.83% | 1.83% |
| 9 | Sunshine Coast | Queensland | 333,436 | 270.770 | +23.14% | 1.33% |
| 10 | Wollongong | New South Wales | 302,739 | 268.944 | +12.57% | 1.21% |
| 11 | Geelong | Victoria | 268,277 | 173.454 | +54.67% | 1.07% |
| 12 | Hobart | Tasmania | 232,606 | 211,656 | +9.90% | 0.93% |
| 13 | Townsville | Queensland | 180,820 | 162.292 | +11.42% | 0.72% |
| 14 | Cairns | Queensland | 152,729 | 133.911 | +14.05% | 0.61% |
| 15 | Darwin | Northern Territory | 148,564 | 120.586 | +23.20% | 0.59% |
| 16 | Toowoomba | Queensland | 136,861 | 105.984 | +29.13% | 0.55% |
| 17 | Ballarat | Victoria | 105,471 | 91.801 | +14.89% | 0.42% |
| 18 | Bendigo | Victoria | 99,122 | 86.079 | +15.15% | 0.40% |
| 19 | Albury–Wodonga | New South Wales/Victoria | 93,603 | 82.083 | +14.03% | 0.37% |
| 20 | Launceston | Tasmania | 87,382 | 82.220 | +6.21% | 0.35% |
| 21 | Mackay | Queensland | 80,148 | 77.293 | +3.69% | 0.32% |
| 22 | Rockhampton | Queensland | 78,592 | 73.681 | +6.67% | 0.31% |
| 23 | Bunbury | Western Australia | 74,363 | 65.608 | +13.34% | 0.30% |
| 24 | Coffs Harbour | New South Wales | 71,822 | 64.243 | +11.80% | 0.29% |
| 25 | Bundaberg | Queensland | 70,921 | 67.341 | +5.32% | 0.28% |
| 26 | Wagga Wagga | New South Wales | 56,442 | 52.042 | +8.45% | 0.23% |
| 27 | Hervey Bay | Queensland | 54,674 | 48.680 | +12.31% | 0.22% |
| 28 | Mildura–Wentworth | Victoria/New South Wales | 51,903 | 47.536 | +9.19% | 0.21% |
| 29 | Shepparton–Mooroopna | Victoria | 51,631 | 46.505 | +11.02% | 0.21% |
| 30 | Port Macquarie | New South Wales | 47,973 | 41.723 | +14.98% | 0.19% |
| 31 | Gladstone–Tannum Sands | Queensland | 45,130 | 41.966 | +7.54% | 0.18% |
| 32 | Tamworth | New South Wales | 42,872 | 38.735 | +10.68% | 0.17% |
| 33 | Traralgon–Morwell | Victoria | 41,984 | 39.705 | +5.74% | 0.17% |
| 34 | Orange | New South Wales | 40,493 | 36.468 | +11.04% | 0.16% |
| 35 | Bowral–Mittagong | New South Wales | 39,887 | 34.858 | +14.43% | 0.16% |
| 36 | Busselton | Western Australia | 38,921 | 30.286 | +28.51% | 0.16% |
| 37 | Dubbo | New South Wales | 38,392 | 33.997 | +12.93% | 0.15% |
| 38 | Warragul–Drouin | Victoria | 37,928 | 29.944 | +26.66% | 0.15% |
| 39 | Geraldton | Western Australia | 37,648 | 35.749 | +5.31% | 0.15% |
| 40 | Nowra–Bomaderry | New South Wales | 37,420 | 33.338 | +12.24% | 0.15% |
| 41 | Bathurst | New South Wales | 36,801 | 32.479 | +13.31% | 0.15% |
| 42 | Warrnambool | Victoria | 35,214 | 32.380 | +8.75% | 0.14% |
| 43 | Albany | Western Australia | 34,205 | 30.656 | +11.58% | 0.14% |
| 44 | Devonport | Tasmania | 30,297 | 29.051 | +4.29% | 0.12% |
| 45 | Kalgoorlie–Boulder | Western Australia | 29,849 | 30.842 | −3.22% | 0.12% |
| 46 | Mount Gambier | South Australia | 29,639 | 27.756 | +6.78% | 0.12% |
| 47 | Lismore | New South Wales | 28,720 | 28.285 | +1.54% | 0.11% |
| 48 | Nelson Bay | New South Wales | 28,051 | 25,074 | +11.87% | 0.11% |
| 49 | Maryborough | Queensland | 27,282 | 26,214 | +4.07% | 0.11% |
| 50 | Burnie–Wynyard | Tasmania | 27,174 | 26.869 | +1.147% | 0.11% |
| 51 | Alice Springs | Northern Territory | 26,534 | 25.186 | +5.35% | 0.11% |
| 52 | Victor Harbor–Goolwa | South Australia | 26,532 | 23.850 | +11.25% | 0.11% |
| 53 | Ballina | New South Wales | 26,381 | 23.509 | +12.22% | 0.11% |
| 54 | Taree | New South Wales | 26,381 | 25.421 | +3.78% | 0.11% |
| 55 | Morisset–Cooranbong | New South Wales | 25,309 | 21.774 | +16.23% | 0.10% |
| 56 | Armidale | New South Wales | 24,504 | 22.464 | +9.08% | 0.10% |
| 57 | Goulburn | New South Wales | 23,835 | 21.484 | +10.94% | 0.10% |
| 58 | Whyalla | South Australia | 21,742 | 21.991 | −1.13% | 0.09% |
| 59 | Gympie | Queensland | 21,599 | 19.510 | +10.71% | 0.09% |
| 60 | Echuca–Moama | Victoria | 21,242 | 19.309 | +10.01% | 0.08% |
| 61 | Forster–Tuncurry | New South Wales | 21,159 | 19.500 | +6.51% | 0.08% |
| 62 | Griffith | New South Wales | 20,251 | 17.900 | +13.13% | 0.08% |
| 63 | Wangaratta | Victoria | 19,318 | 17.686 | +9.23% | 0.08% |
| 64 | St Georges Basin–Sanctuary Point | New South Wales | 19,251 | 12.611 | +52.65% | 0.08% |
| 65 | Grafton | New South Wales | 19,078 | 18.359 | +3.92% | 0.08% |
| 66 | Yeppoon | Queensland | 19,003 | 16.372 | +16.07% | 0.08% |
| 67 | Murray Bridge | South Australia | 18,779 | 16.708 | +12.40% | 0.08% |
| 68 | Mount Isa | Queensland | 18,588 | 20.569 | −9.63% | 0.07% |
| 69 | Camden Haven | New South Wales | 17,835 | 15.741 | +13.30% | 0.07% |
| 70 | Broken Hill | New South Wales | 17,734 | 18.517 | −4.23% | 0.07% |
| 71 | Moe–Newborough | Victoria | 16,812 | 16.674 | +0.83% | 0.07% |
| 72 | Karratha | Western Australia | 16,708 | 16.476 | +1.41% | 0.07% |
| 73 | Horsham | Victoria | 16,514 | 15,894 | +3.90% | 0.07% |
| 74 | Batemans Bay | New South Wales | 16,485 | 15.733 | +4.78% | 0.07% |
| 75 | Singleton | New South Wales | 16,346 | 16.135 | +1.31% | 0.07% |
| 76 | Port Lincoln | South Australia | 16,326 | 15.221 | +7.26% | 0.07% |
| 77 | Ulladulla | New South Wales | 16,213 | 14.149 | +14.59% | 0.06% |
| 78 | Bairnsdale | Victoria | 15,411 | 13.243 | +16.37% | 0.06% |
| 79 | Warwick | Queensland | 15,380 | 14.607 | +5.29% | 0.06% |
| 80 | Kempsey | New South Wales | 15,309 | 14.494 | +5.62% | 0.06% |
| 81 | Sale | Victoria | 15,021 | 14.258 | +5.35% | 0.06% |
| 82 | Ulverstone | Tasmania | 14,490 | 14.109 | +2.70% | 0.06% |
| 83 | Broome | Western Australia | 14,445 | 12.766 | +13.15% | 0.06% |
| 84 | Port Hedland | Western Australia | 14,320 | 13.772 | +3.98% | 0.06% |
| 85 | Port Pirie | South Australia | 14,188 | 14.043 | +1.03% | 0.06% |
| 86 | Emerald | Queensland | 14,119 | 13.219 | +6.81% | 0.06% |
| 87 | Port Augusta | South Australia | 13,799 | 13.658 | +1.03% | 0.06% |
| 88 | Lithgow | New South Wales | 12,973 | 12.249 | +5.91% | 0.05% |
| 89 | Colac | Victoria | 12,547 | 11.778 | +6.53% | 0.05% |
| 90 | Mudgee | New South Wales | 12,410 | 10.483 | +18.38% | 0.05% |
| 91 | Muswellbrook | New South Wales | 12,364 | 11.791 | +4.86% | 0.05% |
| 92 | Esperance | Western Australia | 12,145 | 11.432 | +6.24% | 0.05% |
| 93 | Parkes | New South Wales | 11,224 | 10.941 | +2.59% | 0.04% |
| 94 | Swan Hill | Victoria | 11,103 | 10.430 | +6.45% | 0.04% |
| 95 | Portland | Victoria | 10,900 | 10.715 | +1.73% | 0.04% |
| 96 | Kingaroy | Queensland | 10,398 | 9.808 | +6.02% | 0.04% |
Artikel ini tidak memiliki kategori atau memiliki terlalu sedikit kategori. Bantulah dengan menambahi kategori yang sesuai. Lihat artikel yang sejenis untuk menentukan apa kategori yang sesuai. Tolong bantu Wikipedia untuk menambahkan kategori. Tag ini diberikan pada Desember 2022. |
- ^ Statistics. "Main Features – Main Features". www.abs.gov.au (dalam bahasa Inggris). Australian Bureau of Statistics. Diakses tanggal 2018-04-16.
- ^ "3218.0 – Regional Population Growth, Australia, 2011". Australian Bureau of Statistics. Diakses tanggal 15 April 2018.


