
Berkas:Scientific consensus - Earth's climate is warming (Temperature Anomaly ℃).png

Ukuran asli (3.071 × 1.790 piksel, ukuran berkas: 927 KB, tipe MIME: image/png)
.png)
Ringkasan
| Deskripsi |
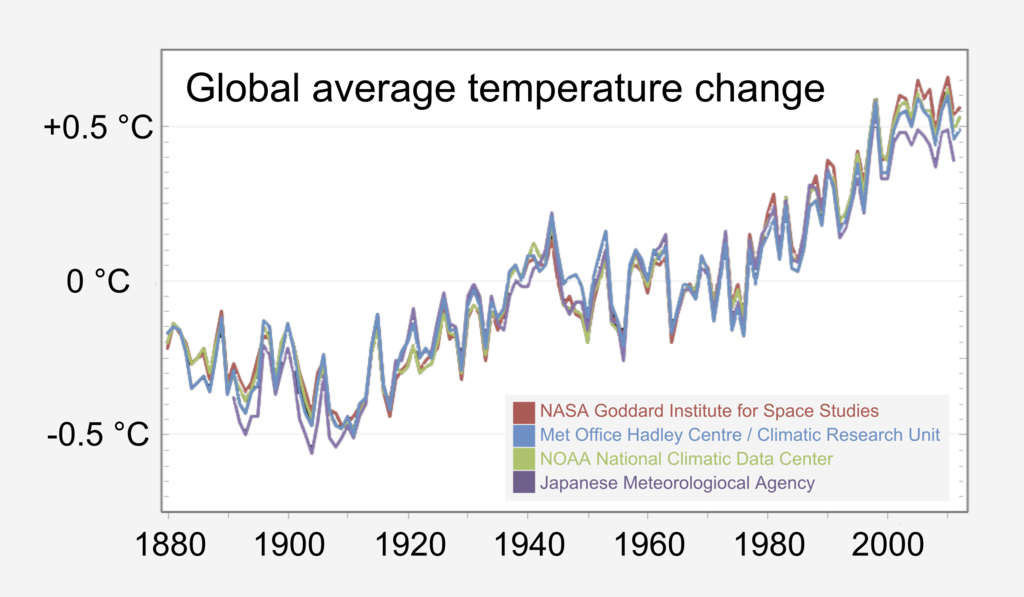
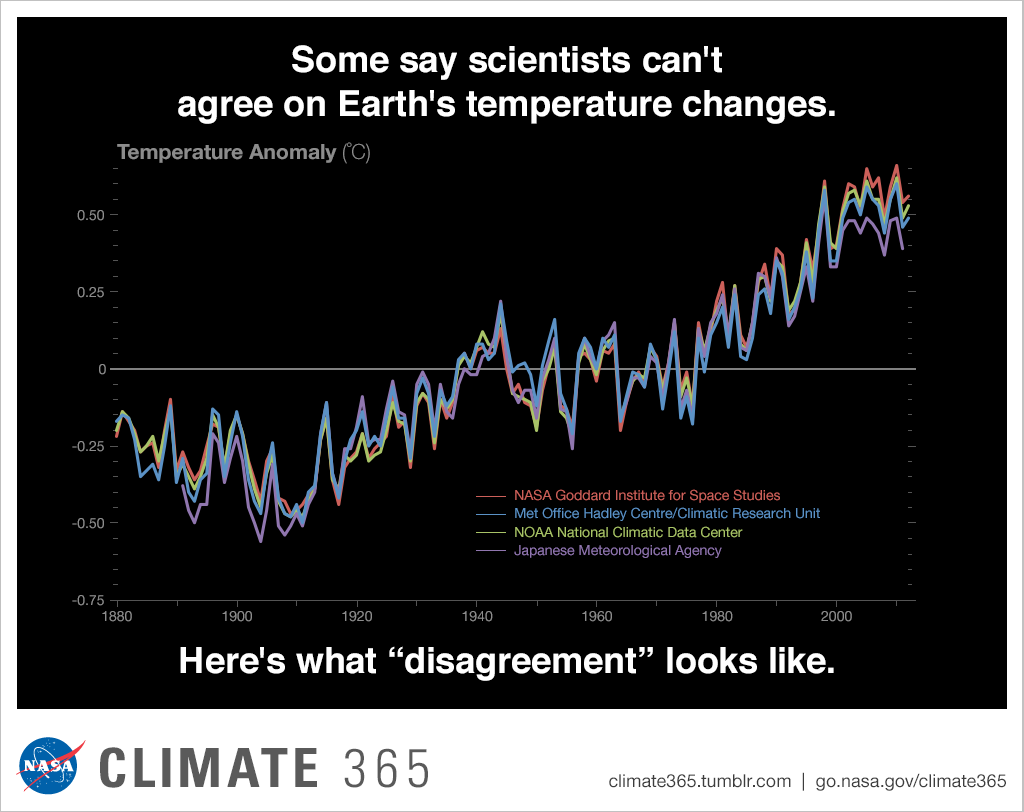
English: Temperature data (in degrees Celsius) from four international science institutions. All show rapid warming in the past few decades and that the last decade has been the warmest on record. Data sources: NASA's Goddard Institute for Space Studies, NOAA National Climatic Data Center, Met Office Hadley Centre/Climatic Research Unit and the Japanese Meteorological Agency. (Graph produced by Earth Science Communications Team at NASA's Jet Propulsion Laboratory | California Institute of Technology) |
| Tanggal | |
| Sumber |
For Version 2 (created 2020-03-22; is slightly updated, more pixels so less pixellation and clearer text when enlarged))
|
| Pembuat | Earth Science Communications Team, Jet Propulsion Laboratory/California Institute of Technology, National Aeronautics and Space Administration (NASA), 4800 Oak Grove Drive, Pasadena, CA 91109 |
| Versi lainnya |
The following SVG image goes directly to the datasets of multiple sources that have been updated. The NASA web page sourcing the above PNG image had not been updated for at least five years. —RCraig09 (bicara) 03:56, 25 March 2020 (UTC)  |
From NASA’s Global Climate Change website - https://climate.nasa.gov/
Temperature anomaly - "In climate change studies, temperature anomalies are more important than absolute temperature. A temperature anomaly is the difference from an average, or baseline, temperature. The baseline temperature is typically computed by averaging 30 or more years of temperature data."
Lisensi
| Berkas ini berada dalam domain publik di Amerika Serikat karena semata-mata diciptakan oleh NASA. Kebijakan hak cipta NASA menyatakan bahwa "materi NASA tidak dilindungi oleh hak cipta kecuali dicatat". (Lihat Template:PD-USGov, Halaman kebijakan hak cipta NASA atau JPL Image Use Policy.) | ||
 |
Peringatan:
|
Riwayat berkas
Klik pada tanggal/waktu untuk melihat berkas ini pada saat tersebut.
| Tanggal/Waktu | Miniatur | Dimensi | Pengguna | Komentar | |
|---|---|---|---|---|---|
| terkini | 23 Maret 2020 03.56 | | 3.071 × 1.790 (927 KB) | RCraig09 | Version 2.1 -- Minor: adjust placement of temperature legends on left. |
| 23 Maret 2020 01.01 |  | 3.071 × 1.790 (927 KB) | RCraig09 | Updated version ... Source image taken from NASA website on 2020-03-22. . . . Removed duplicative commentary. | |
| 18 Agustus 2018 22.01 |  | 735 × 529 (173 KB) | Markworthen | User created page with UploadWizard |
Penggunaan berkas
Tidak ada halaman yang menggunakan berkas ini.
Penggunaan berkas global
Wiki lain berikut menggunakan berkas ini:
- Penggunaan pada ar.wikipedia.org
- Penggunaan pada ca.wikipedia.org
- Penggunaan pada cs.wikipedia.org
- Penggunaan pada en.wikipedia.org
- Penggunaan pada ga.wikipedia.org
.png)